Preservation of unsupported features in Excel files
GemBox.Spreadsheet supports many Microsoft Excel, LibreOffice, and Open Office features, but not all. You can preserve unsupported features when reading a workbook so that they are not lost when writing to a workbook of the same format.
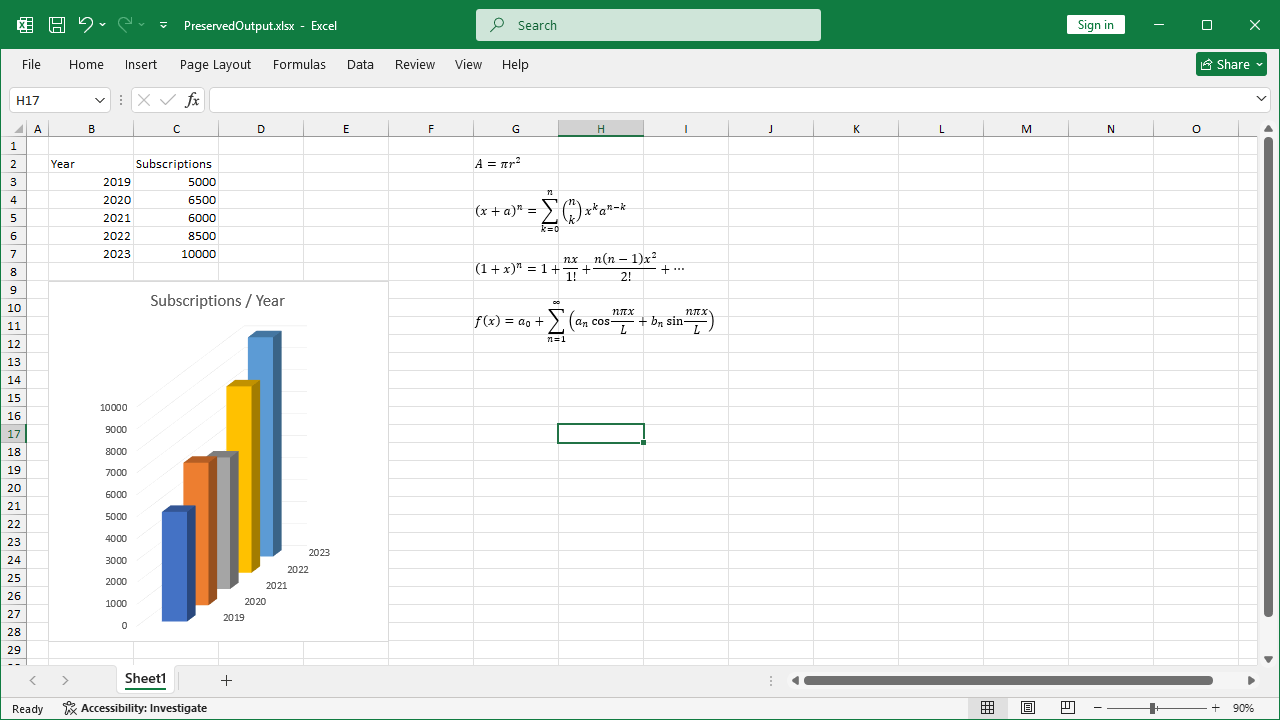
The following example shows how to preserve unsupported features like equations and 3D charts in an Excel workbook from input to output, using C# and VB.NET.
using GemBox.Spreadsheet;

class Program
{
    static void Main()
    {
        // If using the Professional version, put your serial key below.
        SpreadsheetInfo.SetLicense("FREE-LIMITED-KEY");

        // Load Excel workbook, preservation feature is enabled by default.
        var workbook = ExcelFile.Load("%#Preservation.xlsx%");
        var worksheet = workbook.Worksheets[0];

        // Modify the worksheet.
        worksheet.Cells["C6"].Value = 8500;
        worksheet.Cells["C7"].Value = 10000;

        // Save Excel worksheet to an output file of the same format together with
        // preserved information (unsupported features) from the input file.
        workbook.Save("PreservedOutput.xlsx");
    }
}
Imports GemBox.Spreadsheet

Module Program

    Sub Main()

        ' If using the Professional version, put your serial key below.
        SpreadsheetInfo.SetLicense("FREE-LIMITED-KEY")

        ' Load Excel workbook, preservation feature is enabled by default.
        Dim workbook = ExcelFile.Load("%#Preservation.xlsx%")
        Dim worksheet = workbook.Worksheets(0)

        ' Modify the worksheet.
        worksheet.Cells("C6").Value = 8500
        worksheet.Cells("C7").Value = 10000

        ' Save Excel worksheet to an output file of the same format together with
        ' preserved information (unsupported features) from the input file.
        workbook.Save("PreservedOutput.xlsx")

    End Sub
End Module

You can read more about GemBox.Spreadsheet's preservation feature on the Preservation help page.
