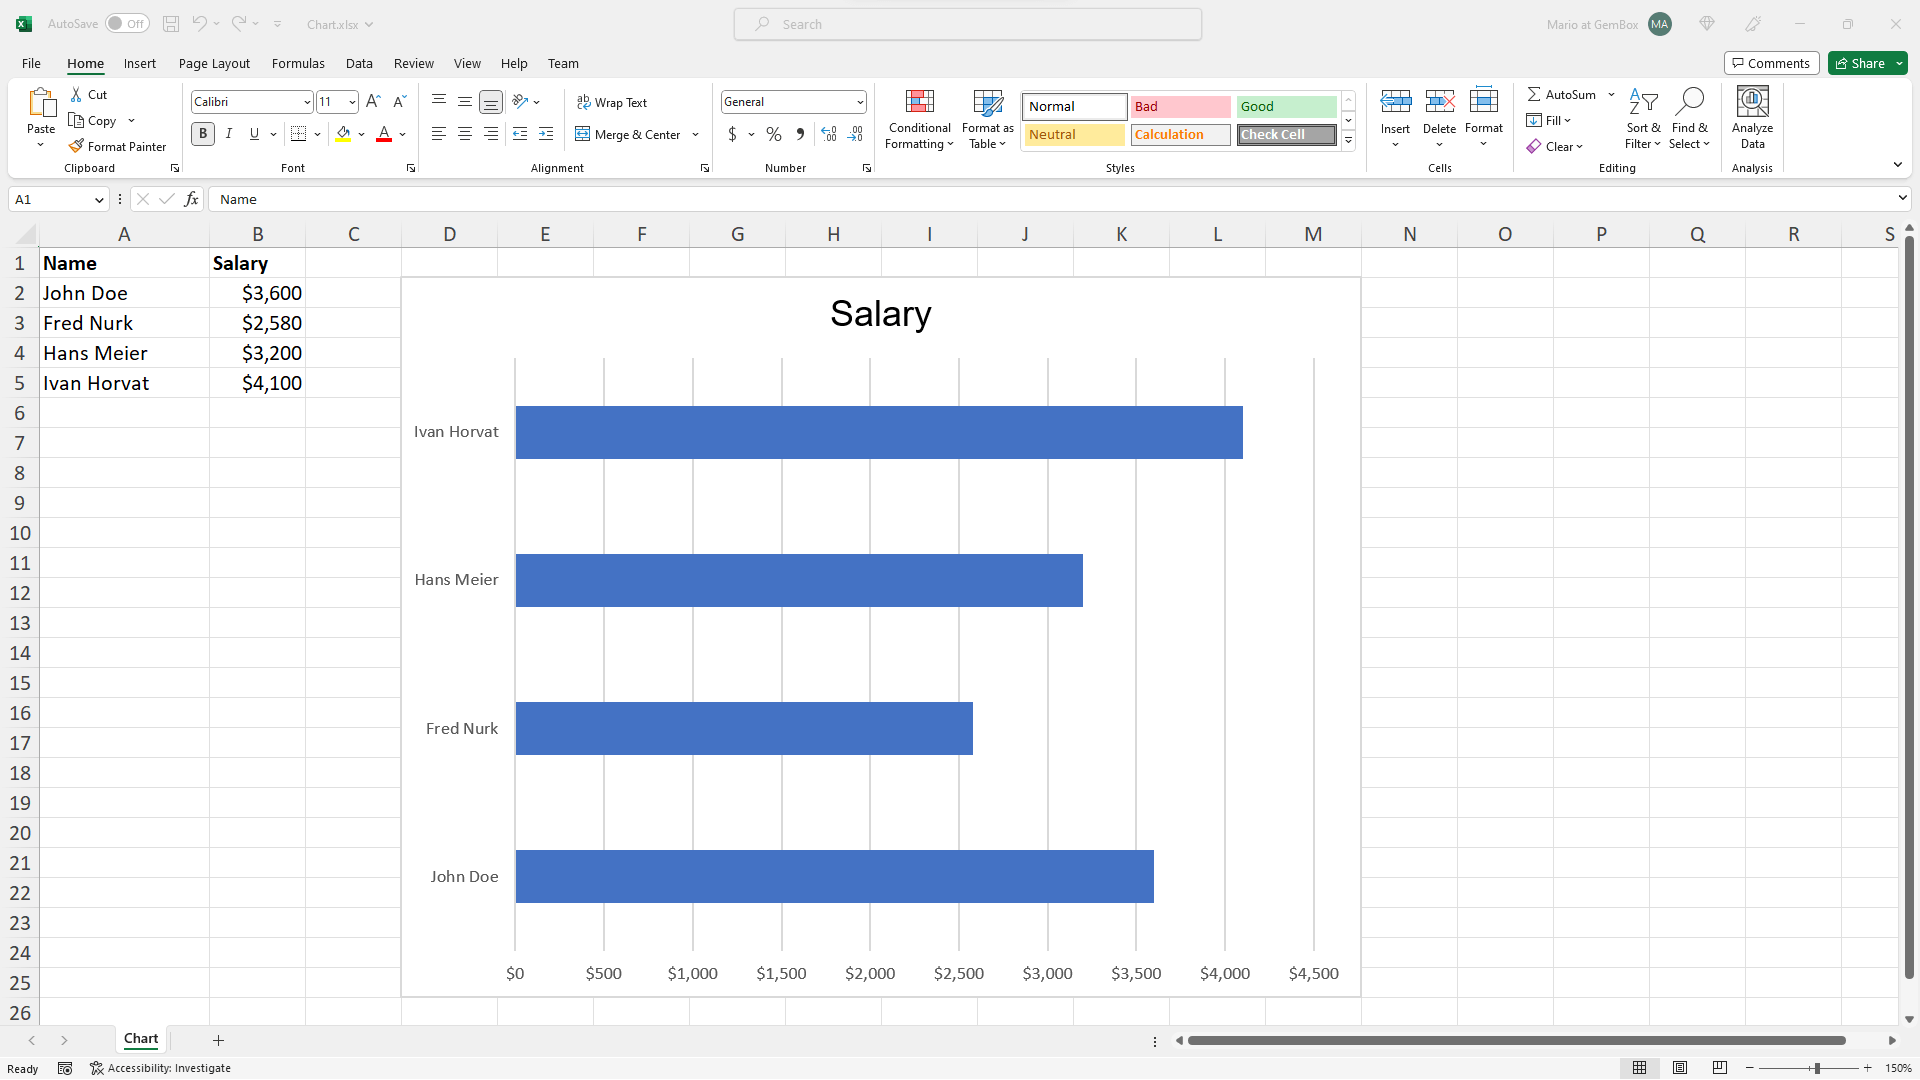
Excel Chart Components
The following example shows how you can use GemBox.Spreadsheet to create a column chart in C# and VB.NET with customized grouping and the configuration of chart component properties.
using GemBox.Spreadsheet;
using GemBox.Spreadsheet.Charts;
using System;

class Program
{
    static void Main()
    {
        // If using the Professional version, put your serial key below.
        SpreadsheetInfo.SetLicense("FREE-LIMITED-KEY");

        var workbook = new ExcelFile();
        var worksheet = workbook.Worksheets.Add("Chart");

        int numberOfYears = %YearsCount%;

        // Add data which is used by the chart.
        worksheet.Cells["A1"].Value = "Name";
        worksheet.Cells["A2"].Value = "John Doe";
        worksheet.Cells["A3"].Value = "Fred Nurk";
        worksheet.Cells["A4"].Value = "Hans Meier";
        worksheet.Cells["A5"].Value = "Ivan Horvat";

        // Generate column titles.
        for (int i = 0; i < numberOfYears; i++)
            worksheet.Cells[0, i + 1].Value = DateTime.Now.Year - numberOfYears + i;

        var random = new Random();
        var range = worksheet.Cells.GetSubrangeAbsolute(1, 1, 4, numberOfYears);

        // Fill the values.
        foreach (var cell in range)
        {
            cell.SetValue(random.Next(1000, 5000));
            cell.Style.NumberFormat = "\"$\"#,##0";
        }

        // Set header row and formatting.
        worksheet.Rows[0].Style.Font.Weight = ExcelFont.BoldWeight;
        worksheet.Rows[0].Style.HorizontalAlignment = HorizontalAlignmentStyle.Center;
        worksheet.Columns[0].SetWidth(3, LengthUnit.Centimeter);

        // Create chart and select data for it.
        var chart = worksheet.Charts.Add<ColumnChart>(%ChartGrouping%, "B7", "O27");
        chart.SelectData(worksheet.Cells.GetSubrangeAbsolute(0, 0, 4, numberOfYears));

        // Set chart title.
        chart.Title.Text = "Column Chart";

        // Set chart legend.
        chart.Legend.IsVisible = true;
        chart.Legend.Position = ChartLegendPosition.Right;

        // Set axis titles.
        chart.Axes.Horizontal.Title.Text = "Years";
        chart.Axes.Vertical.Title.Text = "Salaries";

        // Set value axis scaling, units, gridlines and tick marks.
        var valueAxis = chart.Axes.VerticalValue;
        valueAxis.Minimum = 0;
        valueAxis.Maximum = 6000;
        valueAxis.MajorUnit = 1000;
        valueAxis.MinorUnit = 500;
        valueAxis.MajorGridlines.IsVisible = true;
        valueAxis.MinorGridlines.IsVisible = true;
        valueAxis.MajorTickMarkType = TickMarkType.Outside;
        valueAxis.MinorTickMarkType = TickMarkType.Cross;

        // Make entire sheet print horizontally centered on a single page with headings and gridlines.
        var printOptions = worksheet.PrintOptions;
        printOptions.HorizontalCentered = true;
        printOptions.PrintHeadings = true;
        printOptions.PrintGridlines = true;
        printOptions.FitWorksheetWidthToPages = 1;
        printOptions.FitWorksheetHeightToPages = 1;

        workbook.Save("Chart Components.%OutputFileType%");
    }
}
Imports GemBox.Spreadsheet
Imports GemBox.Spreadsheet.Charts
Imports System

Module Program

    Sub Main()

        ' If using the Professional version, put your serial key below.
        SpreadsheetInfo.SetLicense("FREE-LIMITED-KEY")

        Dim workbook As New ExcelFile()
        Dim worksheet = workbook.Worksheets.Add("Chart")

        Dim numberOfYears As Integer = %YearsCount%

        ' Add data which Is used by the chart.
        worksheet.Cells("A1").Value = "Name"
        worksheet.Cells("A2").Value = "John Doe"
        worksheet.Cells("A3").Value = "Fred Nurk"
        worksheet.Cells("A4").Value = "Hans Meier"
        worksheet.Cells("A5").Value = "Ivan Horvat"

        ' Generate column titles.
        For i As Integer = 0 To numberOfYears - 1
            worksheet.Cells(0, i + 1).Value = DateTime.Now.Year - numberOfYears + i
        Next

        Dim random As New Random()
        Dim range = worksheet.Cells.GetSubrangeAbsolute(1, 1, 4, numberOfYears)

        ' Fill the values.
        For Each cell In range
            cell.SetValue(random.Next(1000, 5000))
            cell.Style.NumberFormat = """$""#,##0"
        Next

        ' Set header row And formatting.
        worksheet.Rows(0).Style.Font.Weight = ExcelFont.BoldWeight
        worksheet.Rows(0).Style.HorizontalAlignment = HorizontalAlignmentStyle.Center
        worksheet.Columns(0).SetWidth(3, LengthUnit.Centimeter)

        ' Create chart And select data for it.
        Dim chart = worksheet.Charts.Add(Of ColumnChart)(%ChartGrouping%, "B7", "O27")
        chart.SelectData(worksheet.Cells.GetSubrangeAbsolute(0, 0, 4, numberOfYears))

        ' Set chart title.
        chart.Title.Text = "Column Chart"

        ' Set chart legend.
        chart.Legend.IsVisible = True
        chart.Legend.Position = ChartLegendPosition.Right

        ' Set axis titles.
        chart.Axes.Horizontal.Title.Text = "Years"
        chart.Axes.Vertical.Title.Text = "Salaries"

        ' Set value axis scaling, units, gridlines and tick marks.
        Dim valueAxis = chart.Axes.VerticalValue
        valueAxis.Minimum = 0
        valueAxis.Maximum = 6000
        valueAxis.MajorUnit = 1000
        valueAxis.MinorUnit = 500
        valueAxis.MajorGridlines.IsVisible = True
        valueAxis.MinorGridlines.IsVisible = True
        valueAxis.MajorTickMarkType = TickMarkType.Outside
        valueAxis.MinorTickMarkType = TickMarkType.Cross

        ' Make entire sheet print horizontally centered on a single page with headings and gridlines.
        Dim printOptions = worksheet.PrintOptions
        printOptions.HorizontalCentered = True
        printOptions.PrintHeadings = True
        printOptions.PrintGridlines = True
        printOptions.FitWorksheetWidthToPages = 1
        printOptions.FitWorksheetHeightToPages = 1

        workbook.Save("Chart Components.%OutputFileType%")
    End Sub
End Module

Excel charts contain many parts or components, such as a legend, title, axes, etc. All the components are contained inside the chart area, but the actual data that's represented by the chart's lines, bars, columns, etc., is located inside the plot area.
Note that not all chart types have all the parts. For example, PieChart doesn't have axes, BarChart and ColumnChart charts don't have markers, etc.
For further information regarding chart components and a visual representation of them, please refer to the Chart Components section from help documentation.