Create and work with Excel pivot tables in C# and VB.NET
This article shows how to use the GemBox.Spreadsheet library to work with Excel pivot tables in C# and VB.NET: creating them from range of cells, summarizing and calculating the values, sorting and filtering, and reading, editing, or removing pivot tables in existing workbooks.
Table of contents
- Create basic pivot table
- Set the data source
- Arrange the fields: rows, columns, values, and report filter
- Summarize the values
- Refresh and calculate
- Calculated fields
- Sort a field
- Filter a field
- Subtotals and grand totals
- Style the pivot table
- Layout and labels
- Read and edit an existing pivot table
- Remove a pivot table
- Frequently asked questions
Create a basic Excel pivot table
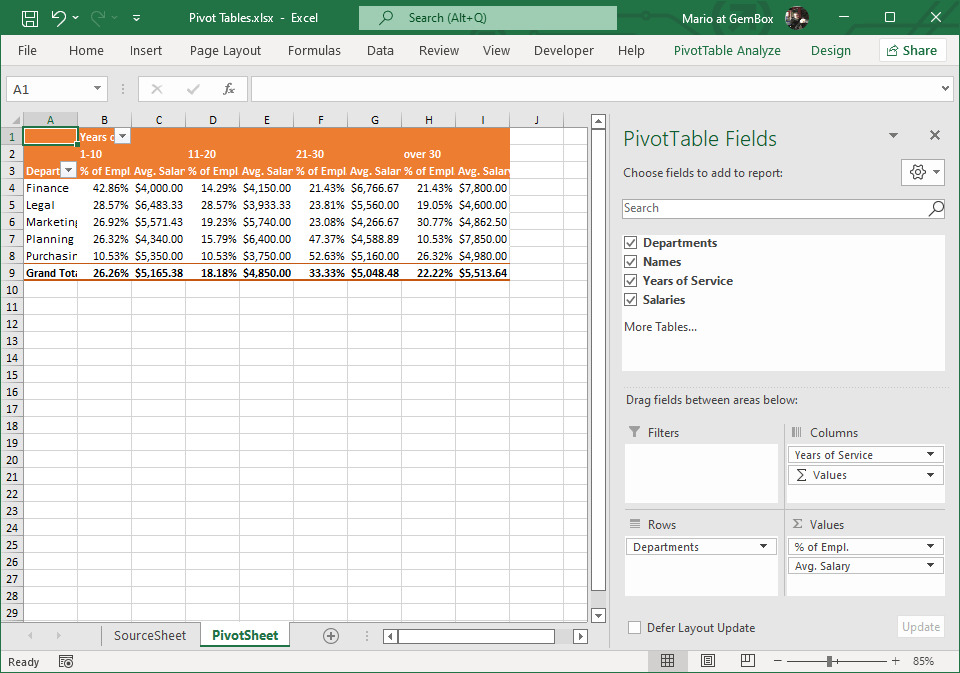
The following example shows how to create a basic pivot table from scratch in C# or VB.NET.
using GemBox.Spreadsheet;
using GemBox.Spreadsheet.PivotTables;

class Program
{
    static void Main()
    {
        // If using the Professional version, put your serial key below.
        SpreadsheetInfo.SetLicense("FREE-LIMITED-KEY");

        var workbook = new ExcelFile();

        // Add a sheet with the source data: Region, Product, Quarter, Sales.
        var sourceSheet = workbook.Worksheets.Add("Sales");
        sourceSheet.Rows[0].Style.Font.Weight = ExcelFont.BoldWeight;

        var cells = sourceSheet.Cells;
        cells["A1"].Value = "Region"; cells["B1"].Value = "Product"; cells["C1"].Value = "Quarter"; cells["D1"].Value = "Sales";
        cells["A2"].Value = "North";  cells["B2"].Value = "Laptop";  cells["C2"].Value = "Q1";      cells["D2"].Value = 1200;
        cells["A3"].Value = "North";  cells["B3"].Value = "Phone";   cells["C3"].Value = "Q1";      cells["D3"].Value = 800;
        cells["A4"].Value = "North";  cells["B4"].Value = "Tablet";  cells["C4"].Value = "Q1";      cells["D4"].Value = 450;
        cells["A5"].Value = "South";  cells["B5"].Value = "Laptop";  cells["C5"].Value = "Q1";      cells["D5"].Value = 1500;
        cells["A6"].Value = "South";  cells["B6"].Value = "Phone";   cells["C6"].Value = "Q1";      cells["D6"].Value = 950;
        cells["A7"].Value = "South";  cells["B7"].Value = "Tablet";  cells["C7"].Value = "Q1";      cells["D7"].Value = 600;
        cells["A8"].Value = "North";  cells["B8"].Value = "Laptop";  cells["C8"].Value = "Q2";      cells["D8"].Value = 1350;
        cells["A9"].Value = "North";  cells["B9"].Value = "Phone";   cells["C9"].Value = "Q2";      cells["D9"].Value = 900;
        cells["A10"].Value = "North"; cells["B10"].Value = "Tablet"; cells["C10"].Value = "Q2";     cells["D10"].Value = 500;
        cells["A11"].Value = "South"; cells["B11"].Value = "Laptop"; cells["C11"].Value = "Q2";     cells["D11"].Value = 1700;
        cells["A12"].Value = "South"; cells["B12"].Value = "Phone";  cells["C12"].Value = "Q2";     cells["D12"].Value = 1050;
        cells["A13"].Value = "South"; cells["B13"].Value = "Tablet"; cells["C13"].Value = "Q2";     cells["D13"].Value = 700;

        // Create a pivot cache from the source range.
        var cache = workbook.PivotCaches.AddWorksheetSource("Sales!A1:D13");

        // Create the pivot table on a new sheet at cell A1.
        var pivotSheet = workbook.Worksheets.Add("PivotTable");
        var pivotTable = pivotSheet.PivotTables.Add(cache, "Sales by Region", "A1");

        // Group rows by Region and columns by Product.
        pivotTable.RowFields.Add("Region");
        pivotTable.ColumnFields.Add("Product");

        // Sum the Sales values.
        var salesField = pivotTable.DataFields.Add("Sales");
        salesField.Function = PivotFieldCalculationType.Sum;
        salesField.Name = "Total Sales";

        // Apply a built-in pivot table style.
        pivotTable.BuiltInStyle = BuiltInPivotStyleName.PivotStyleMedium9;

        workbook.Save("Pivot Tables.xlsx");
    }
}
Imports GemBox.Spreadsheet
Imports GemBox.Spreadsheet.PivotTables

Module Program

    Sub Main()

        ' If using the Professional version, put your serial key below.
        SpreadsheetInfo.SetLicense("FREE-LIMITED-KEY")

        Dim workbook As New ExcelFile()

        ' Add a sheet with the source data: Region, Product, Quarter, Sales.
        Dim sourceSheet = workbook.Worksheets.Add("Sales")
        sourceSheet.Rows(0).Style.Font.Weight = ExcelFont.BoldWeight

        Dim cells = sourceSheet.Cells
        cells("A1").Value = "Region" : cells("B1").Value = "Product" : cells("C1").Value = "Quarter" : cells("D1").Value = "Sales"
        cells("A2").Value = "North" : cells("B2").Value = "Laptop" : cells("C2").Value = "Q1" : cells("D2").Value = 1200
        cells("A3").Value = "North" : cells("B3").Value = "Phone" : cells("C3").Value = "Q1" : cells("D3").Value = 800
        cells("A4").Value = "North" : cells("B4").Value = "Tablet" : cells("C4").Value = "Q1" : cells("D4").Value = 450
        cells("A5").Value = "South" : cells("B5").Value = "Laptop" : cells("C5").Value = "Q1" : cells("D5").Value = 1500
        cells("A6").Value = "South" : cells("B6").Value = "Phone" : cells("C6").Value = "Q1" : cells("D6").Value = 950
        cells("A7").Value = "South" : cells("B7").Value = "Tablet" : cells("C7").Value = "Q1" : cells("D7").Value = 600
        cells("A8").Value = "North" : cells("B8").Value = "Laptop" : cells("C8").Value = "Q2" : cells("D8").Value = 1350
        cells("A9").Value = "North" : cells("B9").Value = "Phone" : cells("C9").Value = "Q2" : cells("D9").Value = 900
        cells("A10").Value = "North" : cells("B10").Value = "Tablet" : cells("C10").Value = "Q2" : cells("D10").Value = 500
        cells("A11").Value = "South" : cells("B11").Value = "Laptop" : cells("C11").Value = "Q2" : cells("D11").Value = 1700
        cells("A12").Value = "South" : cells("B12").Value = "Phone" : cells("C12").Value = "Q2" : cells("D12").Value = 1050
        cells("A13").Value = "South" : cells("B13").Value = "Tablet" : cells("C13").Value = "Q2" : cells("D13").Value = 700

        ' Create a pivot cache from the source range.
        Dim cache = workbook.PivotCaches.AddWorksheetSource("Sales!A1:D13")

        ' Create the pivot table on a new sheet at cell A1.
        Dim pivotSheet = workbook.Worksheets.Add("PivotTable")
        Dim pivotTable = pivotSheet.PivotTables.Add(cache, "Sales by Region", "A1")

        ' Group rows by Region and columns by Product.
        pivotTable.RowFields.Add("Region")
        pivotTable.ColumnFields.Add("Product")

        ' Sum the Sales values.
        Dim salesField = pivotTable.DataFields.Add("Sales")
        salesField.Function = PivotFieldCalculationType.Sum
        salesField.Name = "Total Sales"

        ' Apply a built-in pivot table style.
        pivotTable.BuiltInStyle = BuiltInPivotStyleName.PivotStyleMedium9

        workbook.Save("Pivot Tables.xlsx")
    End Sub
End Module
Set the pivot table's data source
The data that the pivot table uses lives in the cache, not in the table. You build a PivotCache from a worksheet range and then point one or more pivot tables at it.
// A pivot cache reads from a worksheet range - a cell range or a defined name.
var cache = workbook.PivotCaches.AddWorksheetSource("Sales!A1:D13");

// WorksheetSource.CellRange is read-only, so to shrink, grow, or repoint an
// existing pivot's source, call ChangeWorksheetSource on its cache.
cache.ChangeWorksheetSource("Sales!A1:D25");
' A pivot cache reads from a worksheet range - a cell range or a defined name.
Dim cache = workbook.PivotCaches.AddWorksheetSource("Sales!A1:D13")

' WorksheetSource.CellRange is read-only, so to shrink, grow, or repoint an
' existing pivot's source, call ChangeWorksheetSource on its cache.
cache.ChangeWorksheetSource("Sales!A1:D25")
The range can be a cell range or a defined name, and it has to cover every column you want to use as a field.
Arrange the fields: rows, columns, values, and report filter
Each of your source columns is available as a pivot field. You shape the table by placing fields into four areas:
RowFieldsandColumnFieldsgroup the data.DataFieldsare aggregated into the values.PageFieldsbecome a report filter shown above the table.
Each area exposes an Add method that takes the source column name and returns the PivotField so you can configure it.
// Rows and columns group the data; data fields are aggregated.
pivotTable.RowFields.Add("Region");
pivotTable.ColumnFields.Add("Product");

var totalSales = pivotTable.DataFields.Add("Sales");
totalSales.Function = PivotFieldCalculationType.Sum;
totalSales.Name = "Total Sales";

var avgSales = pivotTable.DataFields.Add("Sales");
avgSales.Function = PivotFieldCalculationType.Average;
avgSales.Name = "Avg Sales";

// With two or more data fields, a "Values" group appears. Choose whether it
// sits in the rows (the default) or the columns by adding the DataPivotField.
pivotTable.ColumnFields.Add(pivotTable.DataPivotField);
' Rows and columns group the data; data fields are aggregated.
pivotTable.RowFields.Add("Region")
pivotTable.ColumnFields.Add("Product")

Dim totalSales = pivotTable.DataFields.Add("Sales")
totalSales.Function = PivotFieldCalculationType.Sum
totalSales.Name = "Total Sales"

Dim avgSales = pivotTable.DataFields.Add("Sales")
avgSales.Function = PivotFieldCalculationType.Average
avgSales.Name = "Avg Sales"

' With two or more data fields, a "Values" group appears. Choose whether it
' sits in the rows (the default) or the columns by adding the DataPivotField.
pivotTable.ColumnFields.Add(pivotTable.DataPivotField)
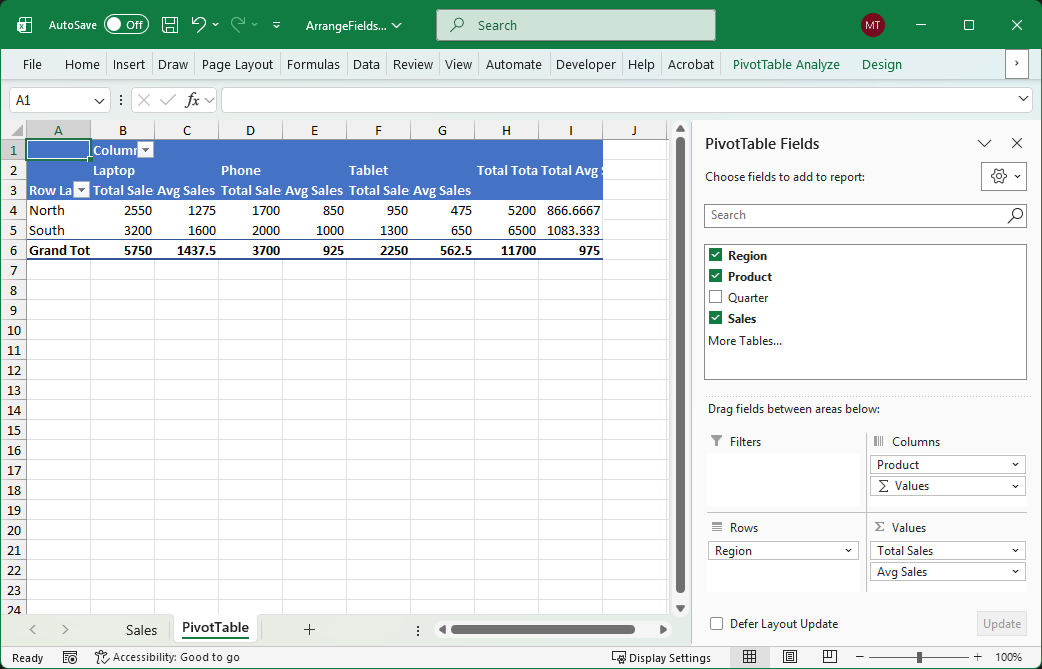
Note that with a single data field there is no "Values" group, so you must not add the DataPivotField at all - doing so throws an exception.
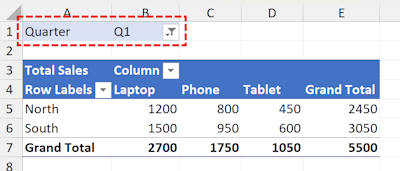
To filter the table, add a field to PageFields. It is shown as a report filter dropdown above the pivot table. You can preset which value it shows through the field's PivotField.CurrentPageItem property.
// A page field becomes a report filter shown above the table.
var quarter = pivotTable.PageFields.Add("Quarter");

// Preset the report filter to show only Q1.
quarter.CurrentPageItem = quarter.PivotItems["Q1"];
' A page field becomes a report filter shown above the table.
Dim quarter = pivotTable.PageFields.Add("Quarter")

' Preset the report filter to show only Q1.
quarter.CurrentPageItem = quarter.PivotItems("Q1")
Summarize the values
You can configure how values are summarized via PivotField properties. The Function property selects the aggregation (Sum, Count, Average, Min, Max, and so on), and ShowDataAs displays the result as a derived calculation such as a percentage of the column or a running total.
// Show each region's total as a share of the column.
var share = pivotTable.DataFields.Add("Sales");
share.Function = PivotFieldCalculationType.Sum;
share.ShowDataAs = PivotFieldDisplayFormat.PercentageOfColumn;
share.Name = "% of Sales";

// Average sale, with the value cells formatted as currency.
var avgSale = pivotTable.DataFields.Add("Sales");
avgSale.Function = PivotFieldCalculationType.Average;
avgSale.NumberFormat = "$#,##0";
avgSale.Name = "Avg Sale";
' Show each region's total as a share of the column.
Dim share = pivotTable.DataFields.Add("Sales")
share.Function = PivotFieldCalculationType.Sum
share.ShowDataAs = PivotFieldDisplayFormat.PercentageOfColumn
share.Name = "% of Sales"

' Average sale, with the value cells formatted as currency.
Dim avgSale = pivotTable.DataFields.Add("Sales")
avgSale.Function = PivotFieldCalculationType.Average
avgSale.NumberFormat = "$#,##0"
avgSale.Name = "Avg Sale"
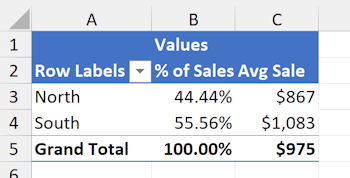
The same field can be added more than once with a different function - the section above, for instance, adds Sales twice to show both its sum and its average.
Refresh and calculate
GemBox.Spreadsheet does not recalculate pivot tables automatically. If the pivot table values are stale or missing, call the PivotTable.Calculate method, which updates the values in the pivot table based on the data in the pivot cache. If the source data changed, first refresh the cache with PivotCache.Refresh, and then recalculate the pivot table.
// Change the data source
sourceSheet.Cells["D2"].Value = 5000;

// Refresh the pivot cache.
pivotTable.PivotCache.Refresh();

// Calculate the pivot table
pivotTable.Calculate();
' Change the data source
sourceSheet.Cells("D2").Value = 5000

' Refresh the pivot cache.
pivotTable.PivotCache.Refresh()

' Calculate the pivot table
pivotTable.Calculate()
Calculated fields
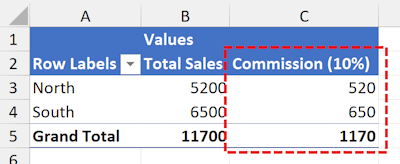
A calculated field is a field whose values come from a formula over the other fields rather than from the source data. The following code snippet shows how to create a calculated Excel field in C#:
// Create the "Sales" data field.
var totalSales = pivotTable.DataFields.Add("Sales");
totalSales.Function = PivotFieldCalculationType.Sum;
totalSales.Name = "Total Sales";

// Create the calculated field that uses "Sales" field in its formula.
var commission = pivotTable.PivotFields.AddCalculated("Commission", "Sales * 0.1");

// Add the calculated field to data field area.
var commissionValue = pivotTable.DataFields.Add(commission);
commissionValue.Name = "Commission (10%)";
' Create the "Sales" data field.
Dim totalSales = pivotTable.DataFields.Add("Sales")
totalSales.Function = PivotFieldCalculationType.Sum
totalSales.Name = "Total Sales"

' Create the calculated field that uses "Sales" field in its formula.
Dim commission = pivotTable.PivotFields.AddCalculated("Commission", "Sales * 0.1")

' Add the calculated field to data field area.
Dim commissionValue = pivotTable.DataFields.Add(commission)
commissionValue.Name = "Commission (10%)"
Sort a field
Use PivotField.Sort to order a field's items. You can sort either by the field's own labels or by values in a data field.
var region = pivotTable.RowFields.Add("Region");
var totalSales = pivotTable.DataFields.Add("Sales");
totalSales.Function = PivotFieldCalculationType.Sum;

// Sort the Region rows by labels in descending order.
region.Sort(descending: true);

// Sort the Region rows in ascending order by their Sales values.
region.Sort(descending: false, totalSales);
Dim region = pivotTable.RowFields.Add("Region")
Dim totalSales = pivotTable.DataFields.Add("Sales")
totalSales.Function = PivotFieldCalculationType.Sum
' Sort the Region rows by labels in descending order.
region.Sort(descending:= true)
' Sort the Region rows in ascending order by their Sales values.
region.Sort(descending:= false, totalSales)If you need to customize the order, move the items in the field's PivotItems collection instead of sorting.
Filter a field
Filtering a field that sits in the rows or columns is different from the report filter described in the Arrange the fields section: the report filter narrows the whole table, while this narrows the items of one field.
For rule-based filtering, use the methods on the PivotTableFilter class:
var product = pivotTable.ColumnFields.Add("Product");
var totalSales = pivotTable.DataFields.Add("Sales");
totalSales.Function = PivotFieldCalculationType.Sum;

// Keep only the top 2 products by their total sales.
pivotTable.Filter.ByTop10(product, totalSales, top: true, percent: false, value: 2);
Dim product = pivotTable.ColumnFields.Add("Product")
Dim totalSales = pivotTable.DataFields.Add("Sales")
totalSales.Function = PivotFieldCalculationType.Sum

' Keep only the top 2 products by their total sales.
pivotTable.Filter.ByTop10(product, totalSales, top:=True, percent:=False, value:=2)
To pick items by hand instead of by a rule, set PivotItem.Hidden on the ones you want to drop:
Subtotals and grand totals
A subtotal is an intermediate total for one group of rows or columns.
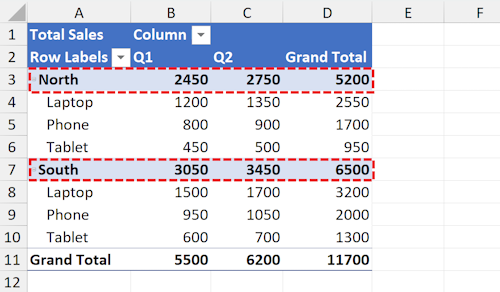
As soon as you nest one field under another - here Product is nested under Region in the rows - each outer group gets its own roll-up line. A subtotal belongs to the grouping field that produces it, which is why you control it through that field's PivotField.Subtotals property.
A grand total totals the entire table rather than a single group, and there is one for each direction.
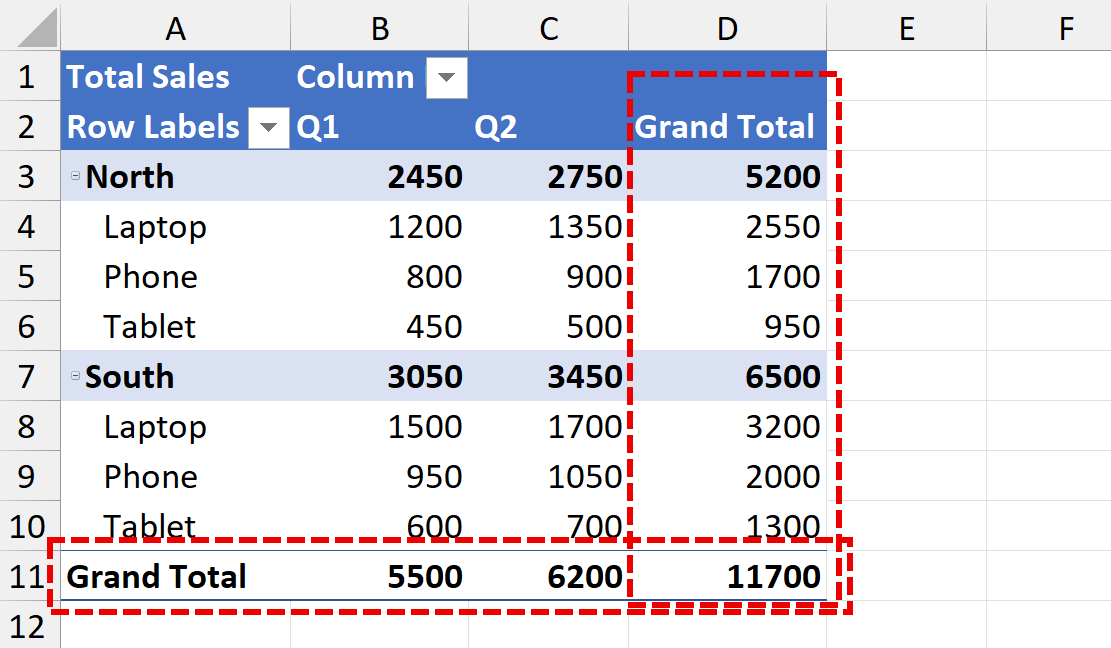
The following code shows how you can hide both subtotals and grand totals.
var region = pivotTable.RowFields.Add("Region");
var product = pivotTable.RowFields.Add("Product");
var quarter = pivotTable.ColumnFields.Add("Quarter");
var totalSales = pivotTable.DataFields.Add("Sales");
totalSales.Function = PivotFieldCalculationType.Sum;
totalSales.Name = "Total Sales";

// Turn off the per-region subtotals.
region.Subtotals = PivotFieldSubtotalTypes.None;

// Turn off the grand total column and the grand total row.
pivotTable.RowGrandTotals = false;
pivotTable.ColumnGrandTotals = false;
Dim region = pivotTable.RowFields.Add("Region")
Dim product = pivotTable.RowFields.Add("Product")
Dim quarter = pivotTable.ColumnFields.Add("Quarter")
Dim totalSales = pivotTable.DataFields.Add("Sales")
totalSales.Function = PivotFieldCalculationType.Sum
totalSales.Name = "Total Sales"

' Turn off the per-region subtotals.
region.Subtotals = PivotFieldSubtotalTypes.None

' Turn off the grand total column and the grand total row.
pivotTable.RowGrandTotals = False
pivotTable.ColumnGrandTotals = False
Read and edit an existing pivot table
You can open a workbook that already contains a pivot table and read its values from the cells in DataRange (the values area) or Range (the whole pivot table).
var workbook = ExcelFile.Load("Pivot Tables.xlsx");
var pivotTable = workbook.Worksheets["PivotTable"].PivotTables[0];

// Read the values from the data range.
foreach (var cell in pivotTable.DataRange)
    Console.WriteLine(cell.GetFormattedValue());
Dim workbook = ExcelFile.Load("Pivot Tables.xlsx")
Dim pivotTable = workbook.Worksheets("PivotTable").PivotTables(0)

' Read the values from the data range.
For Each cell In pivotTable.DataRange
    Console.WriteLine(cell.GetFormattedValue())
Next
The following code snippet shows how to change a field's Function and the pivot table's style.
var workbook = ExcelFile.Load("Pivot Tables.xlsx");
var pivotTable = workbook.Worksheets["PivotTable"].PivotTables[0];

// Change the value field's aggregation, rename it, and restyle the pivot.
var valueField = pivotTable.DataFields[0];
valueField.Function = PivotFieldCalculationType.Average;
valueField.Name = "Average Sales";
pivotTable.BuiltInStyle = BuiltInPivotStyleName.PivotStyleLight16;

workbook.Save("Pivot Tables Edited.xlsx");
Dim workbook = ExcelFile.Load("Pivot Tables.xlsx")
Dim pivotTable = workbook.Worksheets("PivotTable").PivotTables(0)

' Change the value field's aggregation, rename it, and restyle the pivot.
Dim valueField = pivotTable.DataFields(0)
valueField.Function = PivotFieldCalculationType.Average
valueField.Name = "Average Sales"
pivotTable.BuiltInStyle = BuiltInPivotStyleName.PivotStyleLight16

workbook.Save("Pivot Tables Edited.xlsx")
Remove a pivot table
To remove a pivot table, clear the cells it spilled into and remove it from the collection.
// Clear the spilled cells first, then remove the pivot tables from the sheet.
pivotTable.Range.Clear(ClearOptions.All);
pivotSheet.PivotTables.Clear();
' Clear the spilled cells first, then remove the pivot tables from the sheet.
pivotTable.Range.Clear(ClearOptions.All)
pivotSheet.PivotTables.Clear()
Frequently asked questions
- Can I create a pivot table from a database, SQL, OLAP cube, or other external source?
- My pivot table cells are empty - how do I get the calculated values without opening Excel?
- Why doesn't my pivot table show up (or show updated data) when I convert it to PDF or an image?
- How do I change the data source range of an existing pivot table?
- How do I autofit pivot table column widths?
- Can I create slicers or timelines for a pivot table?
- Can I create pivot charts?
Can I create a pivot table from a database, SQL, OLAP cube, or other external source?
No, creating a pivot table is worksheet-source only. External sources, such as a database, OLAP cube, web query, or a PowerPivot / Data Model connection, are preserved when you load and save a file, but GemBox.Spreadsheet cannot create or refresh them from code.
The usual way around this is to pull the data into a worksheet first, for example with ExcelWorksheet.InsertDataTable, and then build a normal worksheet-source pivot over that range.
My pivot table cells are empty - how do I get the calculated values without opening Excel?
GemBox.Spreadsheet does not recalculate pivot tables automatically. To populate the cells yourself - to read them or render the file without Excel - call PivotTable.Calculate, and if the source data changed, first call PivotCache.Refresh. This is covered in the Refresh and calculate section.
Why doesn't my pivot table show up (or show updated data) when I convert it to PDF or an image?
PDF and image conversion renders the result cells, so you have to populate them first: call PivotCache.Refresh and then PivotTable.Calculate before converting as shown in the Refresh and calculate section.
How do I change the data source range of an existing pivot table?
The WorksheetSource.CellRange property is read-only, so call PivotCache.ChangeWorksheetSource with the new range or defined name (see Set the data source).
Note that if the new range defines different fields, you will get an exception. In such a case, you should recreate the pivot table instead.
How do I autofit pivot table column widths?
Refresh the pivot cache, calculate the pivot table, and autofit all columns covered by the pivot table.
// Refresh the pivot cache.
pivotTable.PivotCache.Refresh();

// Calculate the pivot table
pivotTable.Calculate();

// Autofit all columns covered by the pivot table.
var range = pivotTable.Range;
for (int columnIndex = range.FirstColumnIndex; columnIndex <= range.LastColumnIndex; columnIndex++)
    pivotSheet.Columns[columnIndex].AutoFit();
' Refresh the pivot cache.
pivotTable.PivotCache.Refresh()

' Calculate the pivot table
pivotTable.Calculate()

' Autofit all columns covered by the pivot table.
Dim range = pivotTable.Range
For columnIndex As Integer = range.FirstColumnIndex To range.LastColumnIndex
    pivotSheet.Columns(columnIndex).AutoFit()
Next
Can I create slicers or timelines for a pivot table?
Slicers and timelines are preserved on a load-and-save round-trip, but they cannot be created through the API.
Can I create pivot charts?
Pivot charts are not supported through the API - they are preservation-only. As a workaround you can build a regular chart whose series point at the pivot's worksheet range. Our Excel charts guide shows how to create charts with GemBox.Spreadsheet.