Create Excel Charts
The following example shows how you can use GemBox.Spreadsheet to create an Excel chart and select chart's data in your C# and VB.NET applications.
using GemBox.Spreadsheet;
using GemBox.Spreadsheet.Charts;

class Program
{
    static void Main()
    {
        // If using the Professional version, put your serial key below.
        SpreadsheetInfo.SetLicense("FREE-LIMITED-KEY");

        var workbook = new ExcelFile();
        var worksheet = workbook.Worksheets.Add("Chart");

        // Add data which will be used by the Excel chart.
        worksheet.Cells["A1"].Value = "Name";
        worksheet.Cells["A2"].Value = "John Doe";
        worksheet.Cells["A3"].Value = "Fred Nurk";
        worksheet.Cells["A4"].Value = "Hans Meier";
        worksheet.Cells["A5"].Value = "Ivan Horvat";

        worksheet.Cells["B1"].Value = "Salary";
        worksheet.Cells["B2"].Value = 3600;
        worksheet.Cells["B3"].Value = 2580;
        worksheet.Cells["B4"].Value = 3200;
        worksheet.Cells["B5"].Value = 4100;

        // Set header row and formatting.
        worksheet.Rows[0].Style.Font.Weight = ExcelFont.BoldWeight;
        worksheet.Columns[0].SetWidth(3, LengthUnit.Centimeter);
        worksheet.Columns[1].Style.NumberFormat = "\"$\"#,##0";

        // Make entire sheet print on a single page.
        worksheet.PrintOptions.FitWorksheetWidthToPages = 1;
        worksheet.PrintOptions.FitWorksheetHeightToPages = 1;

        // Create Excel chart and select data for it.
        var chart = worksheet.Charts.Add(%ChartType%, "D2", "M25");
        chart.SelectData(worksheet.Cells.GetSubrangeAbsolute(0, 0, 4, 1), true);

        workbook.Save("Chart.%OutputFileType%");
    }
}
Imports GemBox.Spreadsheet
Imports GemBox.Spreadsheet.Charts

Module Program

    Sub Main()

        ' If using the Professional version, put your serial key below.
        SpreadsheetInfo.SetLicense("FREE-LIMITED-KEY")

        Dim workbook As New ExcelFile()
        Dim worksheet = workbook.Worksheets.Add("Chart")

        ' Add data which is used by the Excel chart.
        worksheet.Cells("A1").Value = "Name"
        worksheet.Cells("A2").Value = "John Doe"
        worksheet.Cells("A3").Value = "Fred Nurk"
        worksheet.Cells("A4").Value = "Hans Meier"
        worksheet.Cells("A5").Value = "Ivan Horvat"

        worksheet.Cells("B1").Value = "Salary"
        worksheet.Cells("B2").Value = 3600
        worksheet.Cells("B3").Value = 2580
        worksheet.Cells("B4").Value = 3200
        worksheet.Cells("B5").Value = 4100

        ' Set header row and formatting.
        worksheet.Rows(0).Style.Font.Weight = ExcelFont.BoldWeight
        worksheet.Columns(0).SetWidth(3, LengthUnit.Centimeter)
        worksheet.Columns(1).Style.NumberFormat = """$""#,##0"

        ' Make entire sheet print on a single page.
        worksheet.PrintOptions.FitWorksheetWidthToPages = 1
        worksheet.PrintOptions.FitWorksheetHeightToPages = 1

        ' Create Excel chart and select data for it.
        Dim chart = worksheet.Charts.Add(%ChartType%, "D2", "M25")
        chart.SelectData(worksheet.Cells.GetSubrangeAbsolute(0, 0, 4, 1), True)

        workbook.Save("Chart.%OutputFileType%")
    End Sub
End Module

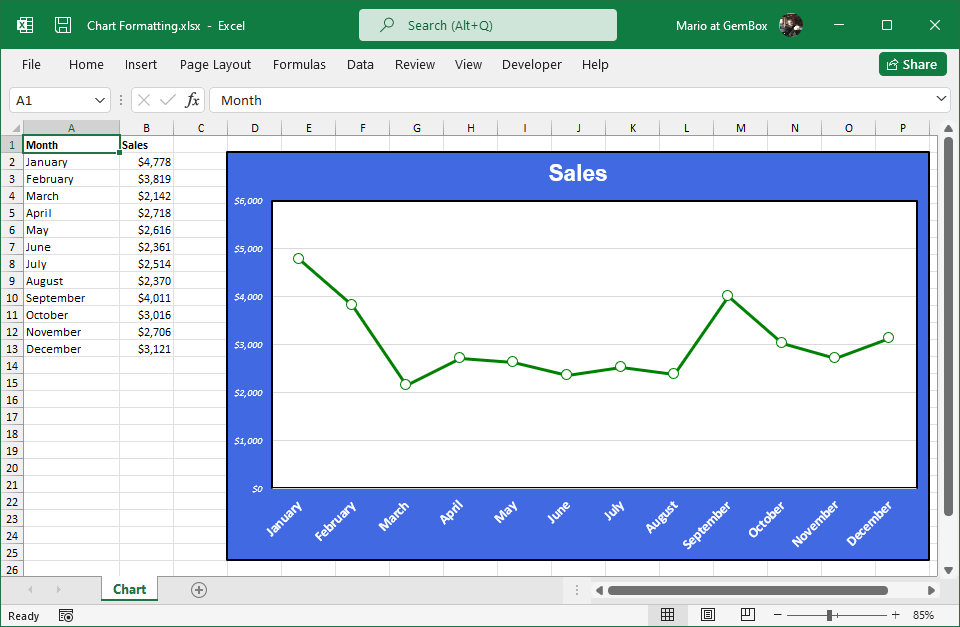
In GemBox.Spreadsheet, charts are represented by the ExcelChart object and are supported in XLSX, PDF, XPS, and image formats. You can use the Convert example to convert an existing workbook with charts into another file format.
For more information about charts, see the Charts help page. The following example shows how you can create an Excel combo (combination) chart in C# and VB.NET and select data for it. The following example shows how to add new and update existing series in an Excel chart.Create Excel combo charts
using GemBox.Spreadsheet;
using GemBox.Spreadsheet.Charts;

class Program
{
    static void Main()
    {
        // If using the Professional version, put your serial key below.
        SpreadsheetInfo.SetLicense("FREE-LIMITED-KEY");

        var workbook = new ExcelFile();
        var worksheet = workbook.Worksheets.Add("Chart");

        // Add data which will be used by the Excel chart.
        worksheet.Cells["A1"].Value = "Name";
        worksheet.Cells["A2"].Value = "John Doe";
        worksheet.Cells["A3"].Value = "Fred Nurk";
        worksheet.Cells["A4"].Value = "Hans Meier";
        worksheet.Cells["A5"].Value = "Ivan Horvat";

        worksheet.Cells["B1"].Value = "Salary";
        worksheet.Cells["B2"].Value = 4023;
        worksheet.Cells["B3"].Value = 3263;
        worksheet.Cells["B4"].Value = 2851;
        worksheet.Cells["B5"].Value = 4694;

        worksheet.Cells["C1"].Value = "Max";
        worksheet.Cells["C2"].Value = 4500;
        worksheet.Cells["C3"].Value = 4300;
        worksheet.Cells["C4"].Value = 4000;
        worksheet.Cells["C5"].Value = 4900;

        worksheet.Cells["D1"].Value = "Min";
        worksheet.Cells["D2"].Value = 3000;
        worksheet.Cells["D3"].Value = 2800;
        worksheet.Cells["D4"].Value = 2500;
        worksheet.Cells["D5"].Value = 3400;

        // Set header row and formatting.
        worksheet.Rows[0].Style.Font.Weight = ExcelFont.BoldWeight;
        worksheet.Columns[0].SetWidth(3, LengthUnit.Centimeter);

        // Set value cells number formatting.
        foreach (var cell in worksheet.Cells.GetSubrange("B2", "D5"))
            cell.Style.NumberFormat = "\"$\"#,##0";

        // Make entire sheet print on a single page.
        worksheet.PrintOptions.FitWorksheetWidthToPages = 1;
        worksheet.PrintOptions.FitWorksheetHeightToPages = 1;

        // Create Excel combo chart and set category labels reference.
        var comboChart = worksheet.Charts.Add<ComboChart>("F2", "O25");
        comboChart.CategoryLabelsReference = "Chart!A2:A5";

        // Make chart legend visible.
        comboChart.Legend.IsVisible = true;
        comboChart.Legend.Position = ChartLegendPosition.Top;

        // Add column chart for displaying salary series.
        var salaryChart = comboChart.Add(%SalaryChartType%);
        salaryChart.Series.Add("=Chart!B1", "Chart!B2:B5");

        // Add line chart for displaying min and max series, those will use the combo chart's secondary axis.
        var minMaxChart = comboChart.Add(%MinMaxChartType%);
        minMaxChart.Series.Add("=Chart!C1", "Chart!C2:C5");
        minMaxChart.Series.Add("=Chart!D1", "Chart!D2:D5");
        minMaxChart.UseSecondaryAxis = true;

        workbook.Save("Combo Chart.%OutputFileType%");
    }
}
Imports GemBox.Spreadsheet
Imports GemBox.Spreadsheet.Charts

Module Program

    Sub Main()

        ' If using the Professional version, put your serial key below.
        SpreadsheetInfo.SetLicense("FREE-LIMITED-KEY")

        Dim workbook As New ExcelFile()
        Dim worksheet = workbook.Worksheets.Add("Chart")

        ' Add data which is used by the Excel chart.
        worksheet.Cells("A1").Value = "Name"
        worksheet.Cells("A2").Value = "John Doe"
        worksheet.Cells("A3").Value = "Fred Nurk"
        worksheet.Cells("A4").Value = "Hans Meier"
        worksheet.Cells("A5").Value = "Ivan Horvat"

        worksheet.Cells("B1").Value = "Salary"
        worksheet.Cells("B2").Value = 4023
        worksheet.Cells("B3").Value = 3263
        worksheet.Cells("B4").Value = 2851
        worksheet.Cells("B5").Value = 4694

        worksheet.Cells("C1").Value = "Max"
        worksheet.Cells("C2").Value = 4500
        worksheet.Cells("C3").Value = 4300
        worksheet.Cells("C4").Value = 4000
        worksheet.Cells("C5").Value = 4900

        worksheet.Cells("D1").Value = "Min"
        worksheet.Cells("D2").Value = 3000
        worksheet.Cells("D3").Value = 2800
        worksheet.Cells("D4").Value = 2500
        worksheet.Cells("D5").Value = 3400

        ' Set header row And formatting.
        worksheet.Rows(0).Style.Font.Weight = ExcelFont.BoldWeight
        worksheet.Columns(0).SetWidth(3, LengthUnit.Centimeter)

        ' Set value cells number formatting.
        For Each cell In worksheet.Cells.GetSubrange("B2", "D5")
            cell.Style.NumberFormat = """$""#,##0"
        Next

        ' Make entire sheet print on a single page.
        worksheet.PrintOptions.FitWorksheetWidthToPages = 1
        worksheet.PrintOptions.FitWorksheetHeightToPages = 1

        ' Create Excel combo chart And set category labels reference.
        Dim comboChart = worksheet.Charts.Add(Of ComboChart)("F2", "O25")
        comboChart.CategoryLabelsReference = "Chart!A2:A5"

        ' Make chart legend visible.
        comboChart.Legend.IsVisible = True
        comboChart.Legend.Position = ChartLegendPosition.Top

        ' Add column chart for displaying salary series.
        Dim salaryChart = comboChart.Add(%SalaryChartType%)
        salaryChart.Series.Add("=Chart!B1", "Chart!B2:B5")

        ' Add line chart for displaying min and max series, those will use the combo chart's secondary axis.
        Dim minMaxChart = comboChart.Add(%MinMaxChartType%)
        minMaxChart.Series.Add("=Chart!C1", "Chart!C2:C5")
        minMaxChart.Series.Add("=Chart!D1", "Chart!D2:D5")
        minMaxChart.UseSecondaryAxis = True

        workbook.Save("Combo Chart.%OutputFileType%")
    End Sub
End Module

Update Excel combo charts
using GemBox.Spreadsheet;
using GemBox.Spreadsheet.Charts;

class Program
{
    static void Main()
    {
        // If using the Professional version, put your serial key below.
        SpreadsheetInfo.SetLicense("FREE-LIMITED-KEY");

        var workbook = ExcelFile.Load("%#Combo.xlsx%");
        var worksheet = workbook.Worksheets["Chart"];
        var comboChart = worksheet.Charts[0] as ComboChart;

        // Update existing series.
        // When setting the values directly the ValuesReference will end up as null.
        var salarySeries = comboChart.Series[0];
        salarySeries.SetValues(3000, 3500, 4000, 4500);

        // Add new data.
        worksheet.Cells["Q1"].Value = "Average";
        foreach (var cell in worksheet.Cells.GetSubrange("Q2:Q5"))
        {
            string row = cell.Row.Name;
            cell.Formula = $"=AVERAGE(C{row},D{row})";
            cell.Style.NumberFormat = "\"$\"#,##0";
        }
        worksheet.Calculate();

        // Add new series.
        var lineChart = comboChart[1] as LineChart;
        var avgSeries = lineChart.Series.Add("=Chart!Q1", "Chart!Q2:Q5");
        avgSeries.Marker.MarkerType = MarkerType.Diamond;
        avgSeries.Marker.Size = 10;

        workbook.Save("Updated Combo.%OutputFileType%");
    }
}
Imports GemBox.Spreadsheet
Imports GemBox.Spreadsheet.Charts

Module Program

    Sub Main()

        ' If using the Professional version, put your serial key below.
        SpreadsheetInfo.SetLicense("FREE-LIMITED-KEY")

        Dim workbook = ExcelFile.Load("%#Combo.xlsx%")
        Dim worksheet = workbook.Worksheets("Chart")
        Dim comboChart = TryCast(worksheet.Charts(0), ComboChart)

        ' Update existing series.
        ' When setting the values directly the ValuesReference will end up as null.
        Dim salarySeries = comboChart.Series(0)
        salarySeries.SetValues(3000, 3500, 4000, 4500)

        ' Add new data.
        worksheet.Cells("Q1").Value = "Average"
        For Each cell In worksheet.Cells.GetSubrange("Q2:Q5")
            Dim row As String = cell.Row.Name
            cell.Formula = $"=AVERAGE(C{row},D{row})"
            cell.Style.NumberFormat = """$""#,##0"
        Next
        worksheet.Calculate()

        ' Add new series.
        Dim lineChart = TryCast(comboChart(1), LineChart)
        Dim avgSeries = lineChart.Series.Add("=Chart!Q1", "Chart!Q2:Q5")
        avgSeries.Marker.MarkerType = MarkerType.Diamond
        avgSeries.Marker.Size = 10

        workbook.Save("Updated Combo.%OutputFileType%")

    End Sub
End Module