Create PowerPoint charts in C# and VB.NET
If you want to add a new chart or update an existing one in your PowerPoint presentation in C# or VB.NET, you need to combine the GemBox.Presentation and GemBox.Spreadsheet .NET libraries.
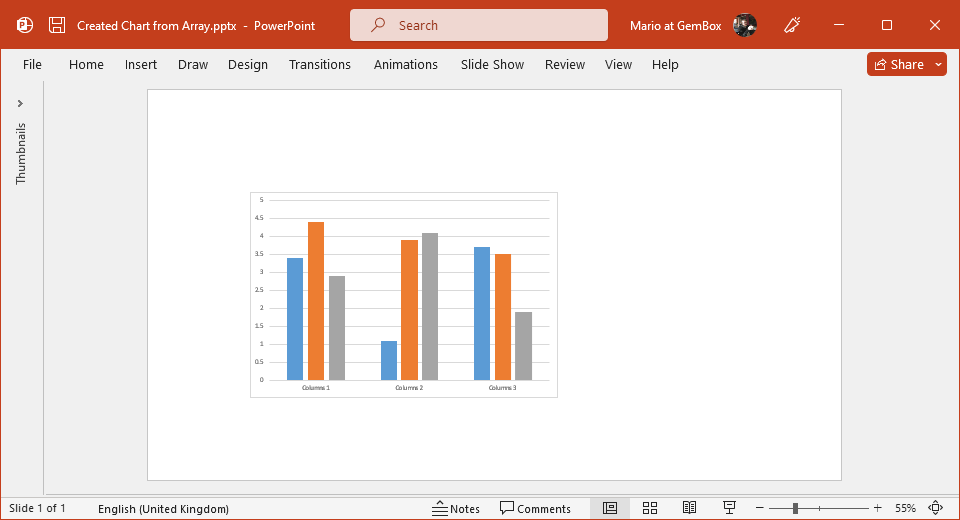
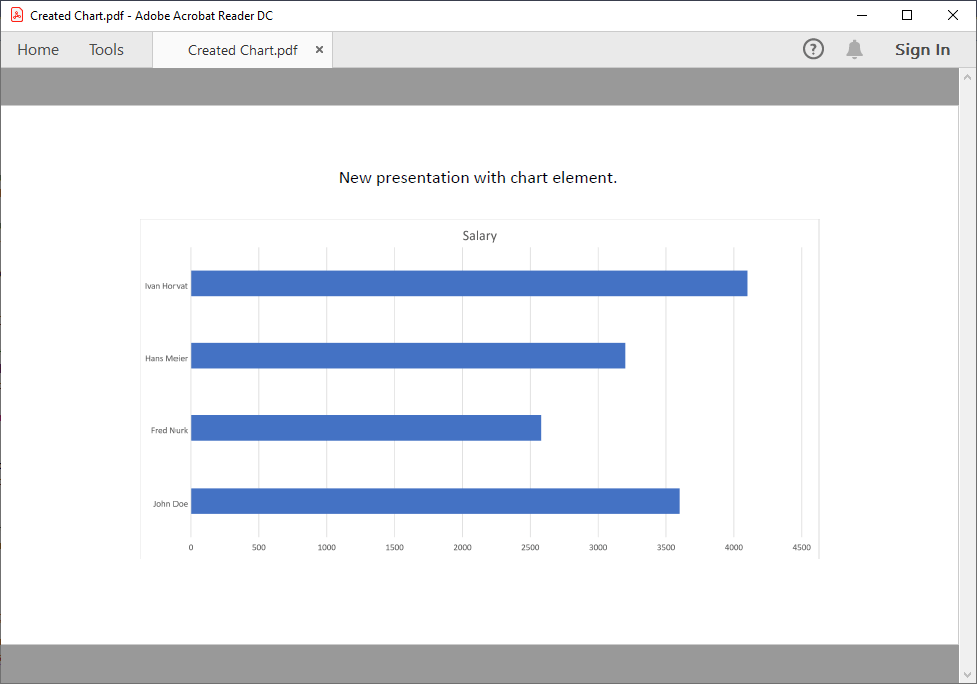
However, if you are just editing an existing presentation and only need to keep an existing chart, only the GemBox.Presentation library is needed. The following example shows how you can create a presentation with a chart element, and save it as a PDF. For more information about charts, visit the Chart Components and Chart Formatting examples. Note, if you don't have a GemBox.Spreadsheet license, you can use its Free mode. The following example shows how you can update the chart element's data in a PowerPoint presentation. Some chart types are not supported through an API (like 3D charts) and won't be represented with the You can find a list of supported chart types on GemBox.Spreadsheet's Charts help page. The following example shows how to create a chart series by directly using array values. Usually, the chart's data is provided as a reference to a worksheet's cell range or a named range. But you can also directly assign an array of numeric values that you want to plot. Using array data may, in some cases, be an easier and more convenient way to work with charts. Such charts are independent of their parent worksheet. However, note that you cannot add or modify such series with Microsoft PowerPoint.Create a chart
using GemBox.Presentation;
using GemBox.Spreadsheet;
using GemBox.Spreadsheet.Charts;

class Program
{
    static void Main()
    {
        // If using the Professional version, put your GemBox.Presentation serial key below.
        ComponentInfo.SetLicense("FREE-LIMITED-KEY");

        // If using the Professional version, put your GemBox.Spreadsheet serial key below.
        SpreadsheetInfo.SetLicense("FREE-LIMITED-KEY");

        var presentation = new PresentationDocument();

        // Add new PowerPoint presentation slide.
        var slide = presentation.Slides.AddNew(SlideLayoutType.Custom);

        // Add simple PowerPoint presentation title.
        var textBox = slide.Content.AddTextBox(ShapeGeometryType.Rectangle,
            116.8, 20, 105, 10, GemBox.Presentation.LengthUnit.Millimeter);

        textBox.AddParagraph().AddRun("New presentation with chart element.");

        // Create PowerPoint chart and add it to slide.
        var chart = slide.Content.AddChart(GemBox.Presentation.ChartType.Bar,
            49.3, 40, 240, 120, GemBox.Presentation.LengthUnit.Millimeter);

        // Get underlying Excel chart.
        ExcelChart excelChart = (ExcelChart)chart.ExcelChart;
        ExcelWorksheet worksheet = excelChart.Worksheet;

        // Add data for Excel chart.
        worksheet.Cells["A1"].Value = "Name";
        worksheet.Cells["A2"].Value = "John Doe";
        worksheet.Cells["A3"].Value = "Fred Nurk";
        worksheet.Cells["A4"].Value = "Hans Meier";
        worksheet.Cells["A5"].Value = "Ivan Horvat";

        worksheet.Cells["B1"].Value = "Salary";
        worksheet.Cells["B2"].Value = 3600;
        worksheet.Cells["B3"].Value = 2580;
        worksheet.Cells["B4"].Value = 3200;
        worksheet.Cells["B5"].Value = 4100;

        // Select data.
        excelChart.SelectData(worksheet.Cells.GetSubrange("A1:B5"), true);

        presentation.Save("Created Chart.%OutputFileType%");
    }
}
Imports GemBox.Presentation
Imports GemBox.Spreadsheet
Imports GemBox.Spreadsheet.Charts

Module Program

    Sub Main()

        ' If using the Professional version, put your GemBox.Presentation serial key below.
        ComponentInfo.SetLicense("FREE-LIMITED-KEY")

        ' If using the Professional version, put your GemBox.Spreadsheet serial key below.
        SpreadsheetInfo.SetLicense("FREE-LIMITED-KEY")

        Dim presentation As New PresentationDocument()

        ' Add new PowerPoint presentation slide.
        Dim slide = presentation.Slides.AddNew(SlideLayoutType.Custom)

        ' Add simple PowerPoint presentation title.
        Dim textBox = slide.Content.AddTextBox(ShapeGeometryType.Rectangle,
            116.8, 20, 105, 10, GemBox.Presentation.LengthUnit.Millimeter)

        textBox.AddParagraph().AddRun("New presentation with chart element.")

        ' Create PowerPoint chart and add it to slide.
        Dim chart = slide.Content.AddChart(GemBox.Presentation.ChartType.Bar,
            49.3, 40, 240, 120, GemBox.Presentation.LengthUnit.Millimeter)

        ' Get underlying Excel chart.
        Dim excelChart As ExcelChart = DirectCast(chart.ExcelChart, ExcelChart)
        Dim worksheet As ExcelWorksheet = excelChart.Worksheet

        ' Add data for Excel chart.
        worksheet.Cells("A1").Value = "Name"
        worksheet.Cells("A2").Value = "John Doe"
        worksheet.Cells("A3").Value = "Fred Nurk"
        worksheet.Cells("A4").Value = "Hans Meier"
        worksheet.Cells("A5").Value = "Ivan Horvat"

        worksheet.Cells("B1").Value = "Salary"
        worksheet.Cells("B2").Value = 3600
        worksheet.Cells("B3").Value = 2580
        worksheet.Cells("B4").Value = 3200
        worksheet.Cells("B5").Value = 4100

        ' Select data.
        excelChart.SelectData(worksheet.Cells.GetSubrange("A1:B5"), True)

        presentation.Save("Created Chart.%OutputFileType%")

    End Sub

End Module
Update a chart
using GemBox.Presentation;
using GemBox.Spreadsheet;
using GemBox.Spreadsheet.Charts;

class Program
{
    static void Main()
    {
        // If using the Professional version, put your GemBox.Presentation serial key below.
        ComponentInfo.SetLicense("FREE-LIMITED-KEY");

        // If using the Professional version, put your GemBox.Spreadsheet serial key below.
        SpreadsheetInfo.SetLicense("FREE-LIMITED-KEY");

        // Load input file and save it in selected output format
        var presentation = PresentationDocument.Load("%#Chart.pptx%");

        // Get PowerPoint chart.
        var chart = ((GraphicFrame)presentation.Slides[0].Content.Drawings[0]).Chart;

        // Get underlying Excel chart and cast it as LineChart.
        var lineChart = (LineChart)chart.ExcelChart;

        // Get underlying Excel sheet and add new cell values.
        var sheet = lineChart.Worksheet;
        sheet.Cells["D1"].Value = "Series 3";
        sheet.Cells["D2"].Value = 8.6;
        sheet.Cells["D3"].Value = 5;
        sheet.Cells["D4"].Value = 7;
        sheet.Cells["D5"].Value = 9;

        // Add new line series to the LineChart.
        lineChart.Series.Add(sheet.Cells["D1"].StringValue, "Sheet1!D2:D5");

        lineChart.RefreshCache();

        presentation.Save("Updated Chart.%OutputFileType%");
    }
}
Imports GemBox.Presentation
Imports GemBox.Spreadsheet
Imports GemBox.Spreadsheet.Charts

Module Program

    Sub Main()

        ' If using the Professional version, put your GemBox.Presentation serial key below.
        ComponentInfo.SetLicense("FREE-LIMITED-KEY")

        ' If using the Professional version, put your GemBox.Spreadsheet serial key below.
        SpreadsheetInfo.SetLicense("FREE-LIMITED-KEY")

        ' Load input file and save it in selected output format
        Dim presentation = PresentationDocument.Load("%#Chart.pptx%")

        ' Get PowerPoint chart.
        Dim chart = DirectCast(presentation.Slides(0).Content.Drawings(0), GraphicFrame).Chart

        ' Get underlying Excel chart and cast it as LineChart.
        Dim lineChart = DirectCast(chart.ExcelChart, LineChart)

        ' Get underlying Excel sheet and add new cell values.
        Dim sheet = lineChart.Worksheet
        sheet.Cells("D1").Value = "Series 3"
        sheet.Cells("D2").Value = 8.6
        sheet.Cells("D3").Value = 5
        sheet.Cells("D4").Value = 7
        sheet.Cells("D5").Value = 9

        ' Add new line series to the LineChart.
        lineChart.Series.Add(sheet.Cells("D1").StringValue, "Sheet1!D2:D5")

        lineChart.RefreshCache()

        presentation.Save("Updated Chart.%OutputFileType%")

    End Sub

End Module
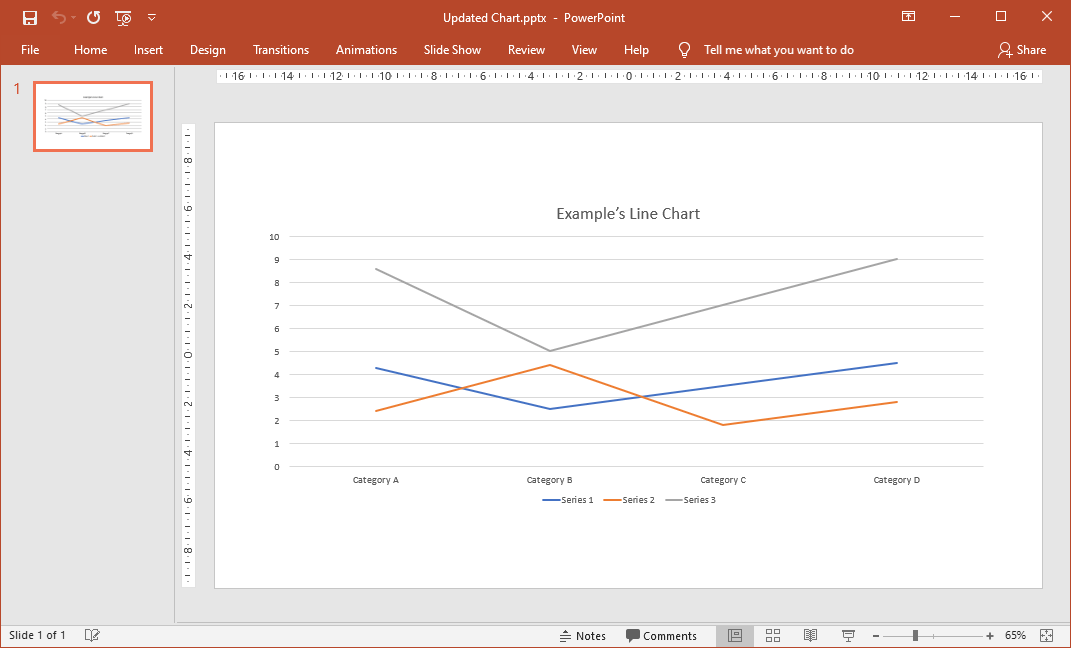
Chart object.Create a chart from array data
using GemBox.Presentation;
using GemBox.Spreadsheet;
using GemBox.Spreadsheet.Charts;

class Program
{
    static void Main()
    {
        // If using the Professional version, put your GemBox.Presentation serial key below.
        ComponentInfo.SetLicense("FREE-LIMITED-KEY");

        // If using the Professional version, put your GemBox.Spreadsheet serial key below.
        SpreadsheetInfo.SetLicense("FREE-LIMITED-KEY");

        var presentation = new PresentationDocument();
        var slide = presentation.Slides.AddNew(SlideLayoutType.Custom);
        var chart = slide.Content.AddChart(GemBox.Presentation.ChartType.Column,
            5, 5, 15, 10, GemBox.Presentation.LengthUnit.Centimeter);

        // Get underlying Excel chart.
        var columnChart = (ColumnChart)chart.ExcelChart;

        // Set chart's category labels from array.
        columnChart.SetCategoryLabels(new string[] { "Columns 1", "Columns 2", "Columns 3" });

        // Add chart's series from arrays.
        columnChart.Series.Add("Values 1", new double[] { 3.4, 1.1, 3.7 });
        columnChart.Series.Add("Values 2", new double[] { 4.4, 3.9, 3.5 });
        columnChart.Series.Add("Values 3", new double[] { 2.9, 4.1, 1.9 });

        presentation.Save("Created Chart from Array.%OutputFileType%");
    }
}
Imports GemBox.Presentation
Imports GemBox.Spreadsheet
Imports GemBox.Spreadsheet.Charts

Module Program

    Sub Main()

        ' If using the Professional version, put your GemBox.Presentation serial key below.
        ComponentInfo.SetLicense("FREE-LIMITED-KEY")

        ' If using the Professional version, put your GemBox.Spreadsheet serial key below.
        SpreadsheetInfo.SetLicense("FREE-LIMITED-KEY")

        Dim presentation As New PresentationDocument()
        Dim slide = presentation.Slides.AddNew(SlideLayoutType.Custom)
        Dim chart = slide.Content.AddChart(GemBox.Presentation.ChartType.Column,
            5, 5, 15, 10, GemBox.Presentation.LengthUnit.Centimeter)

        ' Get underlying Excel chart.
        Dim columnChart = DirectCast(chart.ExcelChart, ColumnChart)

        ' Set chart's category labels from array.
        columnChart.SetCategoryLabels(New String() {"Columns 1", "Columns 2", "Columns 3"})

        ' Add chart's series from arrays.
        columnChart.Series.Add("Values 1", New Double() {3.4, 1.1, 3.7})
        columnChart.Series.Add("Values 2", New Double() {4.4, 3.9, 3.5})
        columnChart.Series.Add("Values 3", New Double() {2.9, 4.1, 1.9})

        presentation.Save("Created Chart from Array.%OutputFileType%")

    End Sub

End Module